Catch the slide in week four, while you can still change the outcome.
Course engagement by week, not by grade report, and the bottleneck course that costs a graduating class. One view for deans, chairs, and faculty.
What a dean or chair gets
Week four, not December
Weekly engagement for every section, so a chair sees the drop while the term can still change.
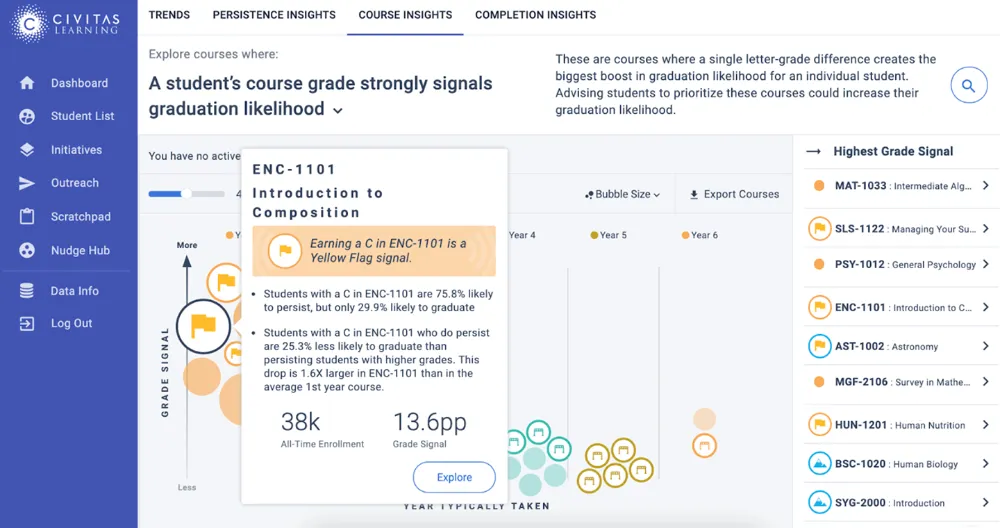
The course that is blocking the degree
Pass rates, withdrawals, and downstream persistence by section, not department average.
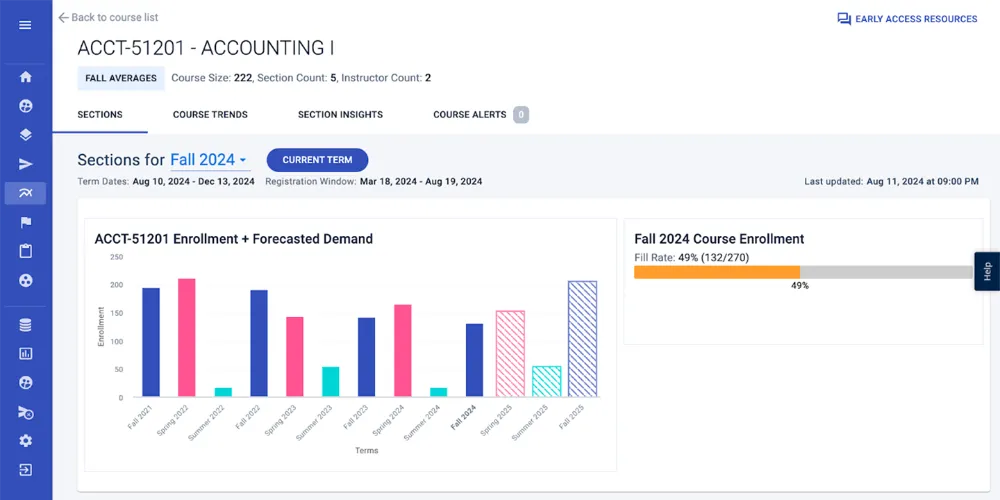
A schedule built from what students need
Section fill forecast by term, so you open the seats that hold students and close the ones that won’t fill.
Program review that starts from a number
Each effort scored against a comparison group, so the dean brings evidence, not participation counts.
See the slide by week, not by grade report
Engagement signals from the LMS and campus systems roll up to section, course, and program, refreshed through the term. Raise an alert from the same screen, and it joins the student record advising sees.
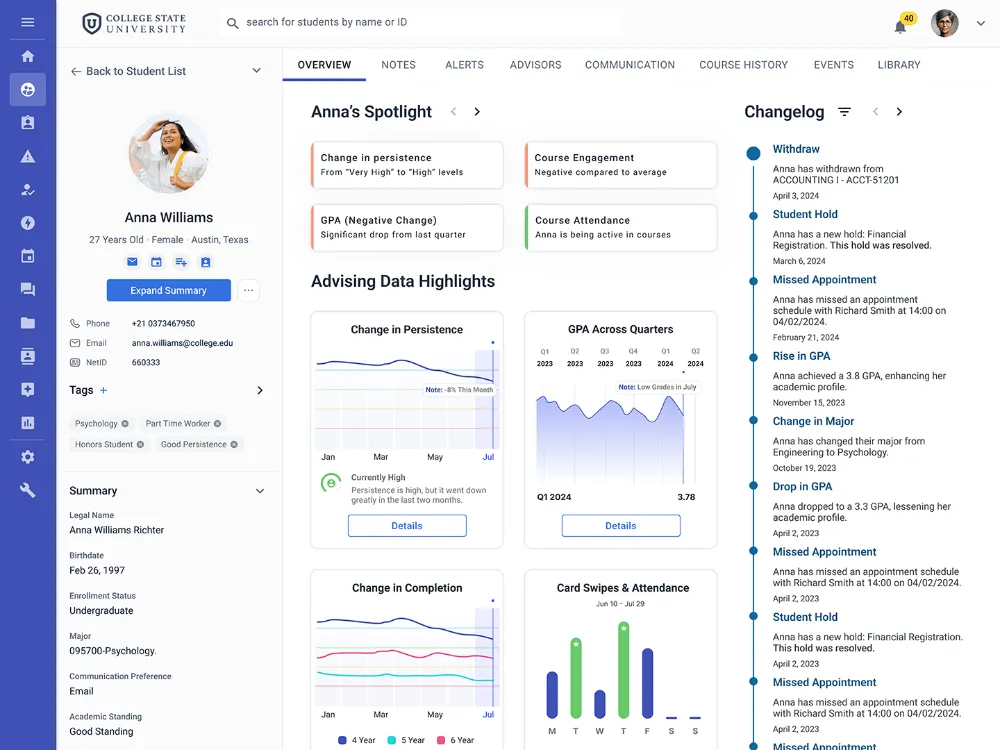
Find the course that is blocking the degree
A gateway course can look healthy on average and still push one population out. Course analysis shows pass rates, withdrawals, and downstream persistence by section, where the average hides the problem.
Build the schedule from the degree plans, not last year's schedule
Forecast section fill from degree plans, past registration, and student progression, and watch fill in real time. It prevents both costly failures: the section that does not fill, and the missing seat that stalls a student thirty credits from a degree.
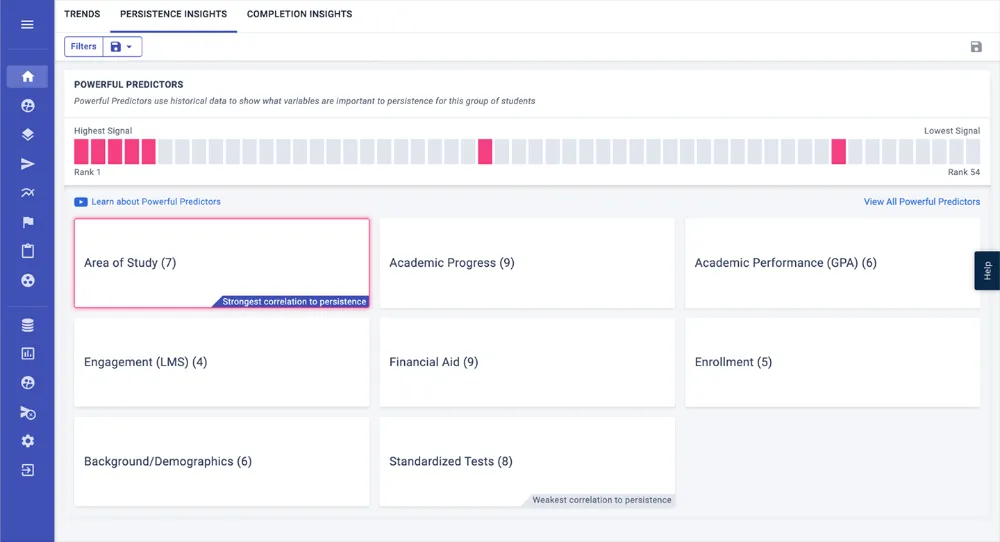
Know which of your programs moved a number
Initiative analytics score each effort against a matched comparison group, by program and population. A curriculum or faculty development case becomes a measured result you can take to the faculty senate.
Every office gets a number. This page is one of six.
Enrollment, engagement, persistence, graduation, and career outcomes, each measured against a comparison group. The same data, the same model, one ledger for the cabinet, the board, and the Department of Education.
Civitas works under FERPA as a school official you designate, with a published data sharing agreement and platform specifications. Accessibility conformance reports are available on request. Security and privacy → Trust Center →
“The platform allows me to target majors or specific cohorts. When I receive information about scholarships or internships, I can now send targeted emails to only those who qualify.”Meredith Denton-HedrickFaculty Mentor for Engineering, Physics, Geology, & Environmental Studies, Austin Community College
“The biggest benefit is the ability to look at predictive factors and see what interventions work for various groups.”Penny KellyVice President of Academic Affairs, SUNY Broome Community College
“So much value has come from looking at different populations of students. What works for one group does not apply for others.”Dr. Mark ApplefordVice Provost of Undergraduate Studies, University of Texas at San Antonio
Questions institutions ask about academic leaders & faculty
Short answers, in the words a cabinet uses. For anything not here, ask us directly.
How do we find the courses that are blocking student progress?
Look by section, not department average. Course insights show pass rates, withdrawals, and downstream persistence per section — which is how a gateway course that looks fine overall turns out to block one population.
Can we see student engagement before grades are posted?
Yes, by week. Engagement signals from the LMS and campus systems roll up to section, course, and program, so a chair sees the drop while the term can still change.
How do we forecast course demand?
A model predicts section fill by term from degree plans, past registration, and student progression, so you open the sections students need and close the ones that won't fill.
What can a dean do with this that a dashboard does not give them?
Which programs moved a number, and which didn't. Initiative analytics scores each effort against a comparison group, so program review starts from measured impact, not participation counts.
Does faculty development show up in the numbers?
It has in the published research. The Student Success Impact Report has measured persistence effects from faculty development and early alert practice, alongside advising and outreach.
Do faculty have to log in to another system?
No. The signals surface where faculty already work, and the alert an instructor raises becomes part of the same student record advising sees.
Bring your questions. Leave with an estimate you can defend.
A 45-minute working session: we start from your public IPEDS figures, show what the platform found at institutions like yours, and size the outcome — before anyone touches your data.