Win the board meeting.
Answer the cabinet's question the day it is asked, with a comparison group behind it. Retention, graduation, engagement, and graduate earnings by program, from one governed dataset that reconciles across the board deck, the self-study, and the federal filing.
What an IR office gets
The answer the same day
One governed dataset with shared definitions turns a three-week extract into an afternoon.
Numbers that reconcile
The board deck, the self-study, and the IPEDS submission use the same retention figure, with the intervention record attached.
A method that survives scrutiny
Every initiative measured against a matched comparison group of your own students, with the confidence interval.
Your analysts back on analysis
The data assembly that consumes the office is built and maintained for you.
Answer the cabinet's question the day it is asked
One governed dataset, with dashboards and drill-downs the institution can use without routing every request through your office. Shared access stops IR from being the queue every strategic question waits in.
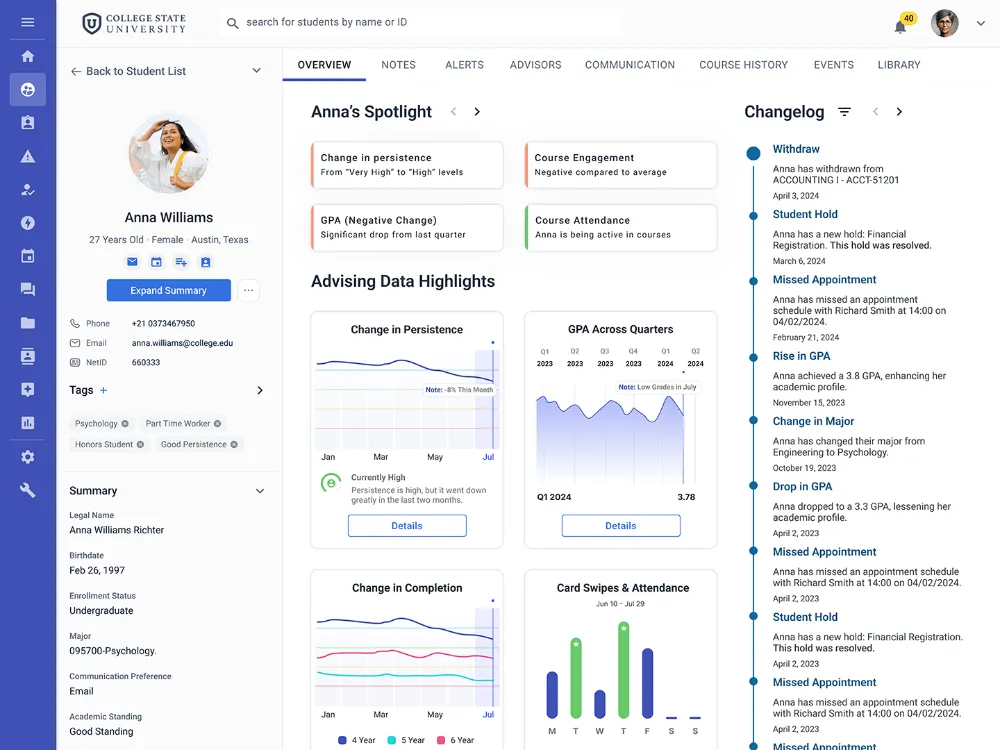
Report by population, because the average hides the finding
Break every outcome out by enrollment status, transfer status, modality, and the populations you care about. In the 2026 Impact Report, academic planning produced a 2% persistence lift overall and 15% for online students. One of those numbers is worth acting on.
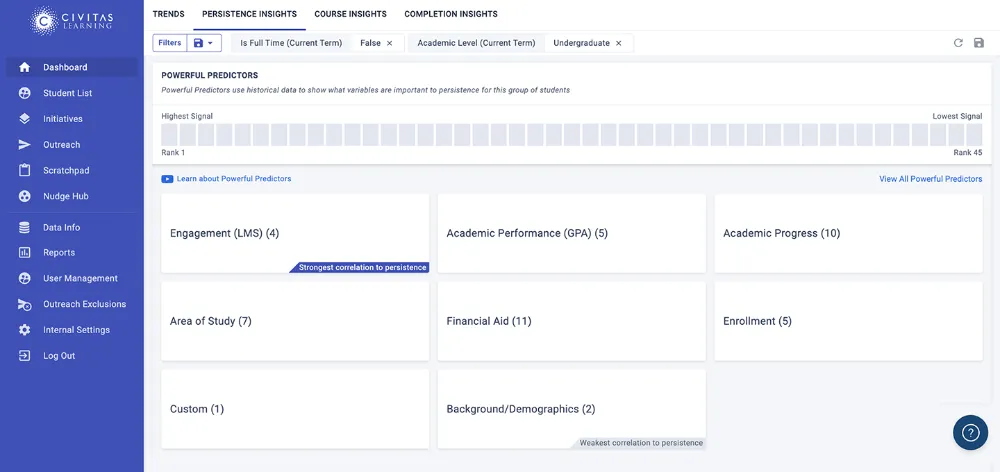
Show which initiative moved the number, and which did not
Every initiative, course, program, and policy scored against a matched comparison group, with lift and confidence interval. Across more than 220 measured initiatives, only 40 to 60 percent produced a measurable outcome — the finding that changes a budget conversation.
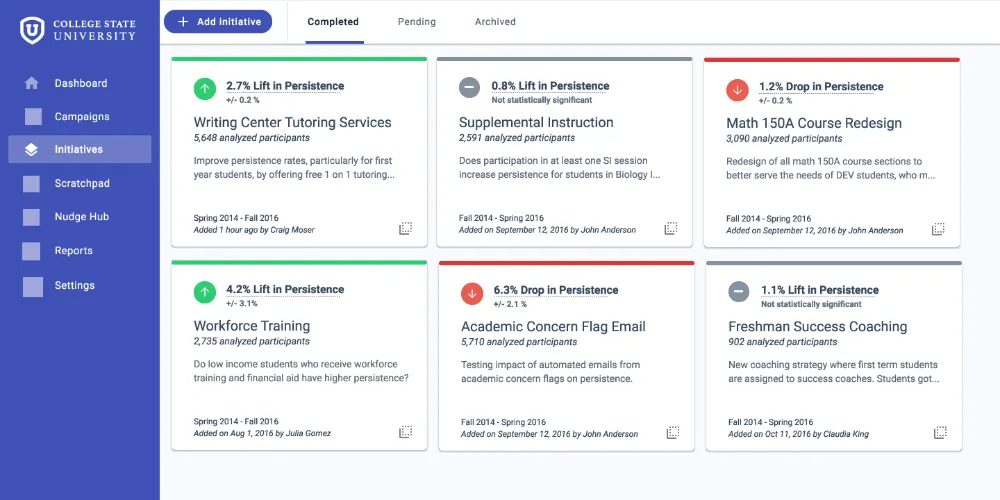
Audit the model rather than taking the accuracy figure on faith
Each prediction shows the factors behind it. Models are documented and retrained each term on your data, and IR can examine behavior by population — a review a single accuracy number cannot replace.
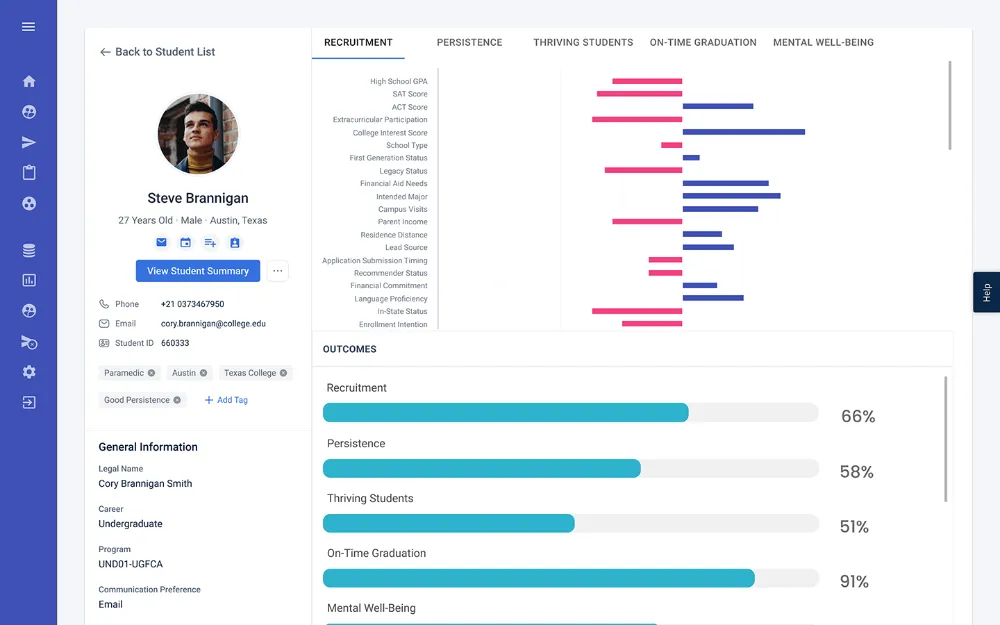
Take the governed dataset into your own tools
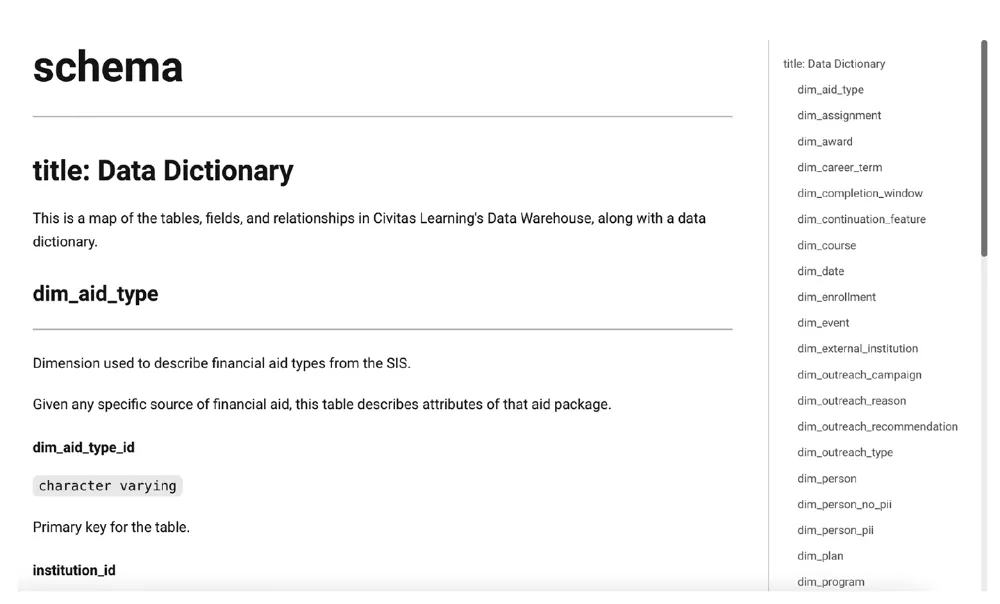
Cloud-hosted data warehouse capabilities include the underlying Civitas predictions, so your analysts can run their own research and reporting and extend the intelligence across your stack.
Every office gets a number. This page is one of six.
Enrollment, engagement, persistence, graduation, and career outcomes, each measured against a comparison group. The same data, the same model, one ledger for the cabinet, the board, and the Department of Education.
Civitas works under FERPA as a school official you designate, with a published data sharing agreement and platform specifications. Accessibility conformance reports are available on request. Security and privacy → Trust Center →
“With Civitas Learning we can make ongoing adjustments in real-time instead of the traditional approach of analyzing when the term ends.”Dr. Kim McLainAssociate Vice President / Dean of Health Sciences & Institutional Effectiveness, SUNY Broome Community College
“I appreciate the Civitas Learning platform's initiative analysis capabilities. They allow us to easily account for self-selection bias and quickly run robust analyses to understand what works.”Dr. Steve WilkersonChief Analytics Officer, University of Texas at San Antonio
Questions institutions ask about institutional research & effectiveness
Short answers, in the words a cabinet uses. For anything not here, ask us directly.
How does this help with accreditation and IPEDS reporting?
One governed dataset produces the numbers, with the intervention record attached. The retention figure in the self-study, the board deck, and IPEDS reconcile, and you can show what you did about the number, not just the number.
Can institutional research audit the predictive models?
Yes — all six: persistence, graduation, engagement, thriving, grades, and career outcomes, each trained on your data and retrained each term. Every prediction shows its drivers and the models are documented, so IR can examine behavior by population instead of trusting one accuracy figure.
How do you build the comparison group?
From your own students. Civitas matches participants with similar non-participants on the characteristics that predict the outcome, then reports the difference with a confidence interval. That separates a measured lift from a year-over-year change.
Will this replace the analyses our office already runs?
No. It removes the data assembly that consumes the office, so analysts work on questions instead of reconciling extracts from six systems.
Can we break results out by student population?
Yes, and averages usually hide the finding. In the 2026 Impact Report, academic planning produced a 2 percent persistence lift overall and 15 percent for online students.
Can we export the data to our own tools?
Yes. The governed dataset feeds your analytics stack, so existing reporting and visualization tools keep working.
Bring your questions. Leave with an estimate you can defend.
A 45-minute working session: we start from your public IPEDS figures, show what the platform found at institutions like yours, and size the outcome — before anyone touches your data.