Fund what works. Retire what doesn't.
Every initiative, policy, program, and course measured against a matched comparison group, so the budget follows the evidence. Some interventions have no effect. You should know which.
Ensure the Effectiveness of Your Investments
Institutional Leaders
Learn what works for which student groups, find inefficiencies and course availability gaps, and allocate for ROI.
Institutional Research & Effectiveness
Evaluate impact on students and subgroups quickly, so every office decides with data.
Academic Deans & Faculty
Match offerings to demand, find course and grade thresholds that hurt outcomes, and target academic support, faculty development, and curriculum updates.
Advising & Student Success Teams
Know which courses hinder success and which supports work for whom, and point students to the right resources.
Regularly Assess the Impact of Your Strategies
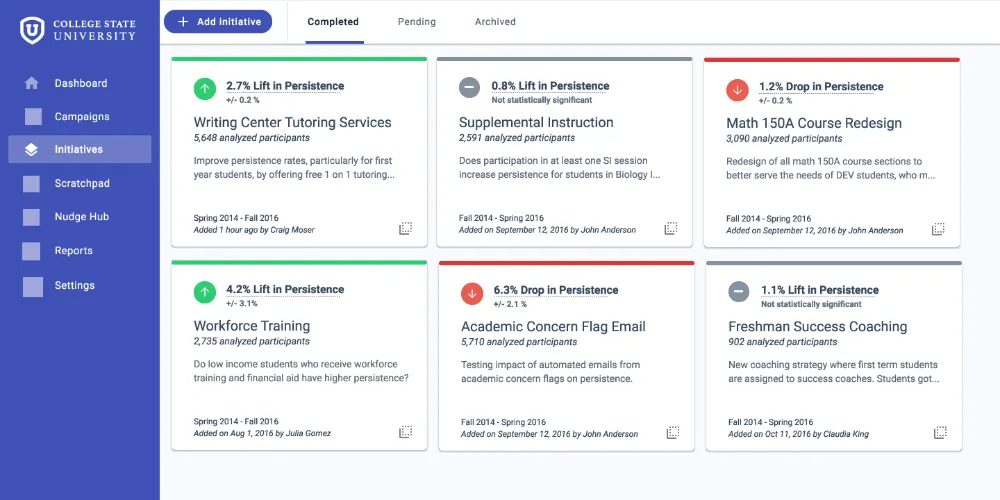
Evaluate a wide range of strategies routinely with data-science-backed analysis of each initiative, program, and policy, then put resources and students where they do the most good.
Understand What Helps Specific Student Groups
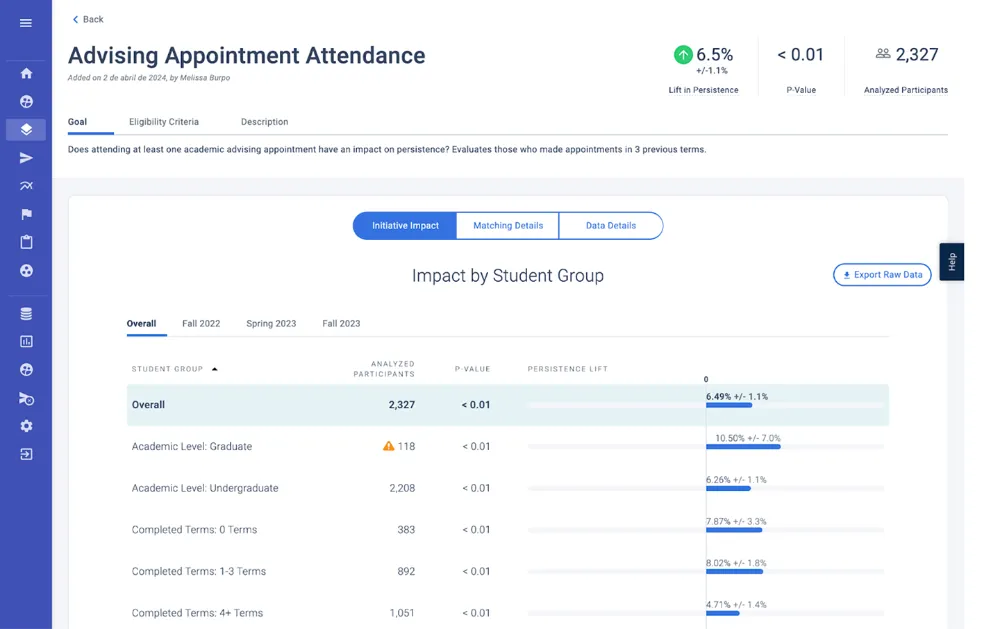
Track specific segments over time — such as transfer students likely to persist but not graduate — and see how success strategies affect each group and student through the term.
Reveal Course Impact on Student Outcomes
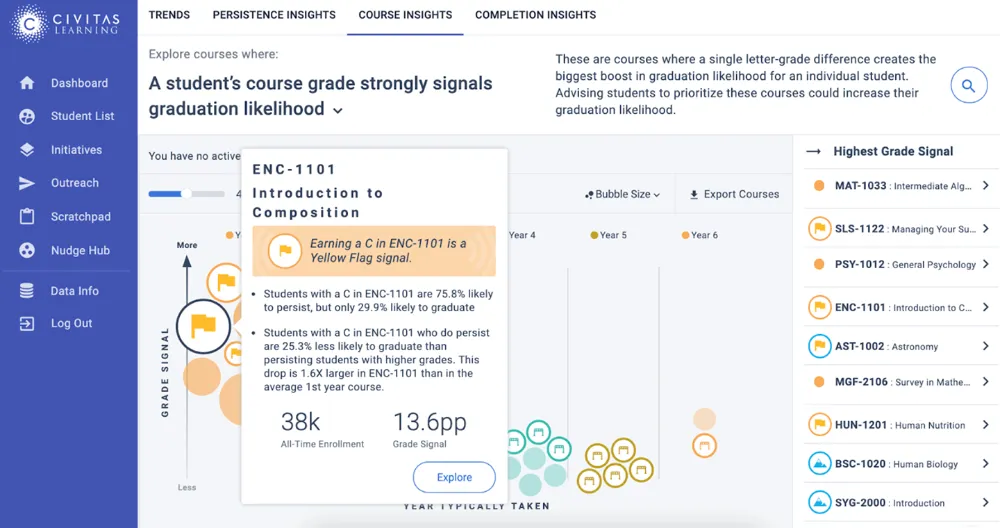
See how sections and courses affect persistence and graduation for students and subgroups. Redesign courses to clear bottlenecks, and target academic support at the hardest courses.
Deep Dive into Your Data for Strategic Insight
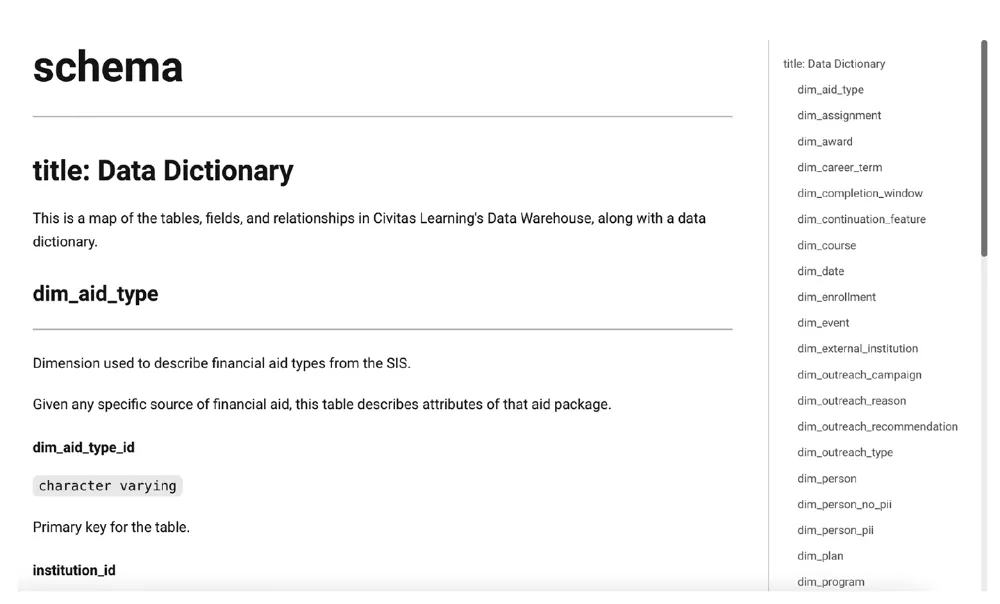
Run in-depth research and reporting on consolidated data, including Civitas predictive insights, to answer questions for accreditation, fundraising, and management.
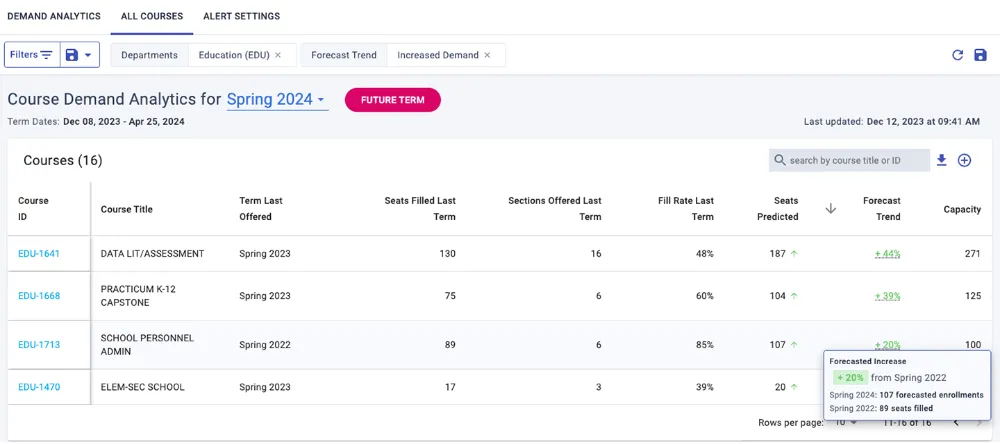
Align Course Offerings with Course Demand
Avoid over- and under-provisioned courses. See demand shifts over time, seat accuracy, who typically takes a course, and how many students plan to enroll next term.
Every office gets a number. This page is one of six.
Enrollment, engagement, persistence, graduation, and career outcomes, each measured against a comparison group. The same data, the same model, one ledger for the cabinet, the board, and the Department of Education.
Civitas works under FERPA as a school official you designate, with a published data sharing agreement and platform specifications. Accessibility conformance reports are available on request. Security and privacy → Trust Center →
“Our team uses the Civitas Learning platform to analyze a variety of programs and initiatives, giving us an idea of exactly which activities are really contributing to retention and persistence.”Allison HoffmannAssociate Provost of Enrollment Management & Student Success, Northwest Missouri State University
Questions institutions ask about ensure efficacy & roi
Short answers, in the words a cabinet uses. For anything not here, ask us directly.
How do you prove an initiative worked?
Compare students who received it with matched students who did not. Civitas builds the comparison group from your records, matching on what predicts the outcome, and reports the difference with a confidence interval. Year-over-year change is not proof: the cohort changed too.
What percentage of student success initiatives actually work?
Between 40 and 60 percent produce a measurable outcome, across more than 220 initiatives in multi-year partner data. Roughly half the spend produces something you cannot see, and the other half produces nothing — which is why you measure.
What is the return on the investment?
Partners average $4 returned for every $1 invested, across more than 220 measured initiatives. Retained students pay another year of net price, which is why the home page calculator starts from headcount and net price.
What happens when an initiative does not work?
You stop funding it — that is the point. Ask any vendor to name an intervention of theirs that failed; one that has never found one is not measuring.
How long before we see a measured result?
One term of a cohort, once participants and a comparison group exist. Longitudinal effects, like a five-year sustained lift, take longer.
Can we measure initiatives we run outside the platform?
Yes, if the participation record can be brought in. The measurement needs to know who received the intervention and when.
How do we report this to a board?
As a ledger: each initiative, its population, lift, and confidence interval, beside the dollar value. That is a format a president can defend.
Bring your questions. Leave with an estimate you can defend.
A 45-minute working session: we start from your public IPEDS figures, show what the platform found at institutions like yours, and size the outcome — before anyone touches your data.