Move the graduation rate one blocked course at a time.
Students thirty credits from a degree stall on one section. Find them by name the term before, open the seat, and count the graduates. Graduation is the number the state, the board, and the Department of Education all read.
Enable Your Entire Institution to Support On-Time Completion
Executive Leaders
Shape curriculum, forecast course demand, and strengthen initiatives, policies, and programs that remove enrollment barriers.
Deans & Faculty
Tackle curricular barriers, allocate resources, raise alerts, and work with other teams in one system.
Advising & Success Teams
Give holistic support, see what drives success, and prioritize engagement all term.
Students
Stay on track and balance life and academics with collaborative degree planning and scheduling.
Understand Student Outcome Risks Earlier
Find students who need support sooner — from those unlikely to thrive academically to those at risk of not graduating on time. Institution-specific predictive AI shows the factors behind success, so teams act together.
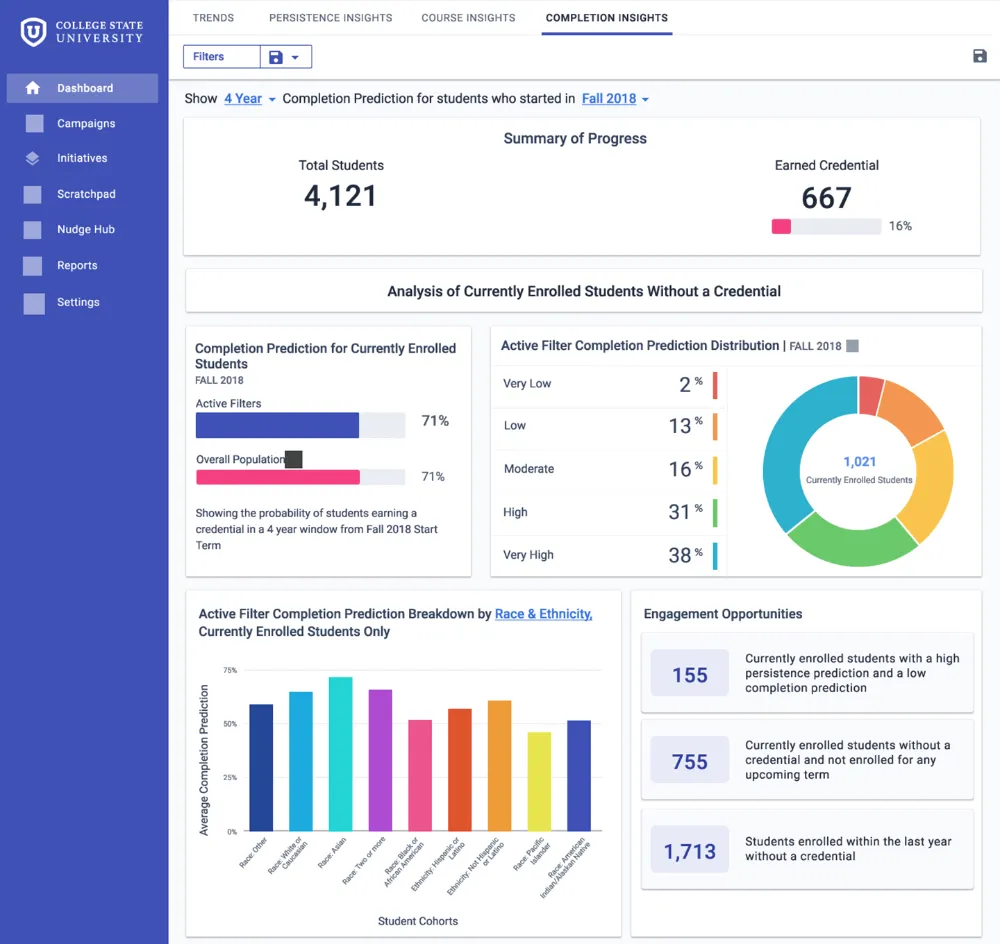
Identify Curricular Bottlenecks
See which courses hurt graduation for which students, to target interventions and fix course sequencing.
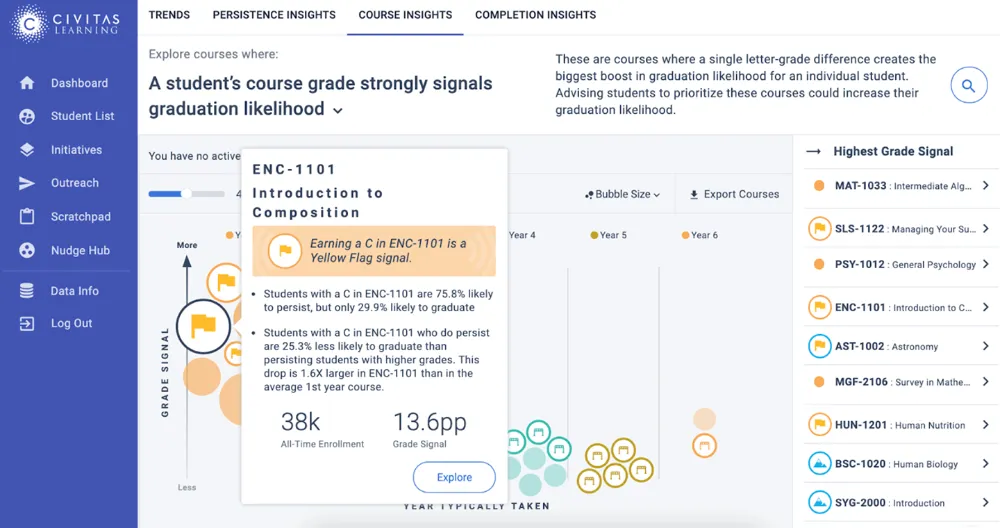
Monitor Course Fill Rates
Track which sections fill fastest and which modalities, days, and times students choose, and respond in real time.
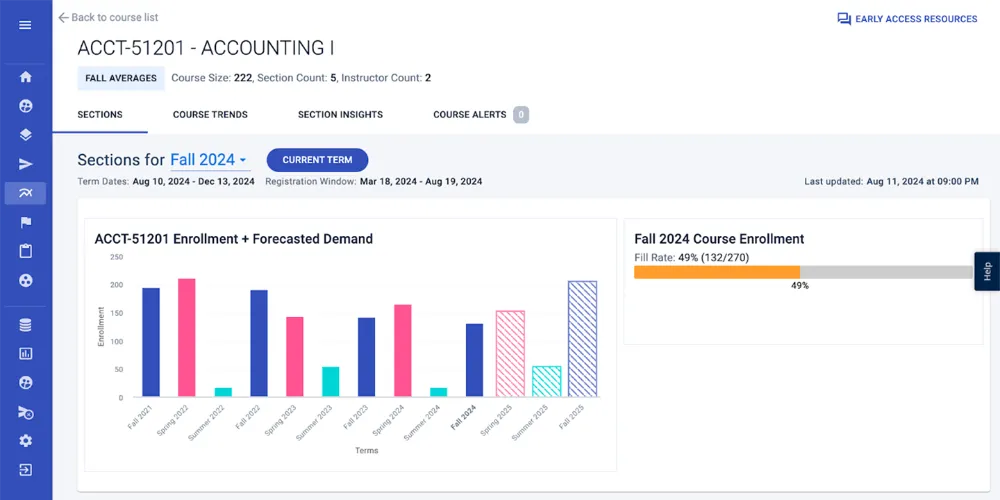
Accurately Forecast Course Demand
Offer the right courses and sections, so students graduate on time and you spend less on under-enrolled classes.
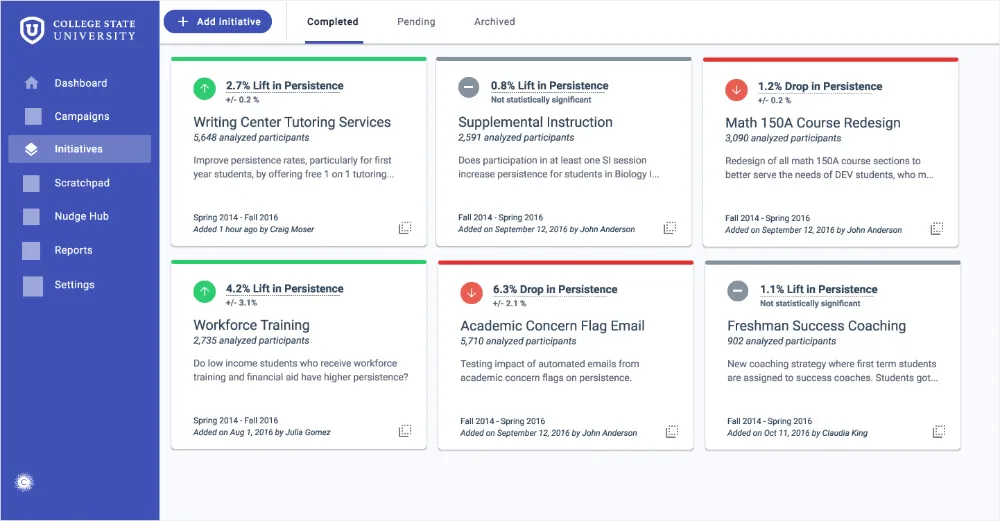
Improve the Impact of Initiatives & Policies
See how initiatives affect specific student groups, and adjust communication and programs in time to speed progress to degree.
Streamline the Registration Experience
One end-to-end experience: students plan, schedule, and register, working with advisors toward on-time graduation.
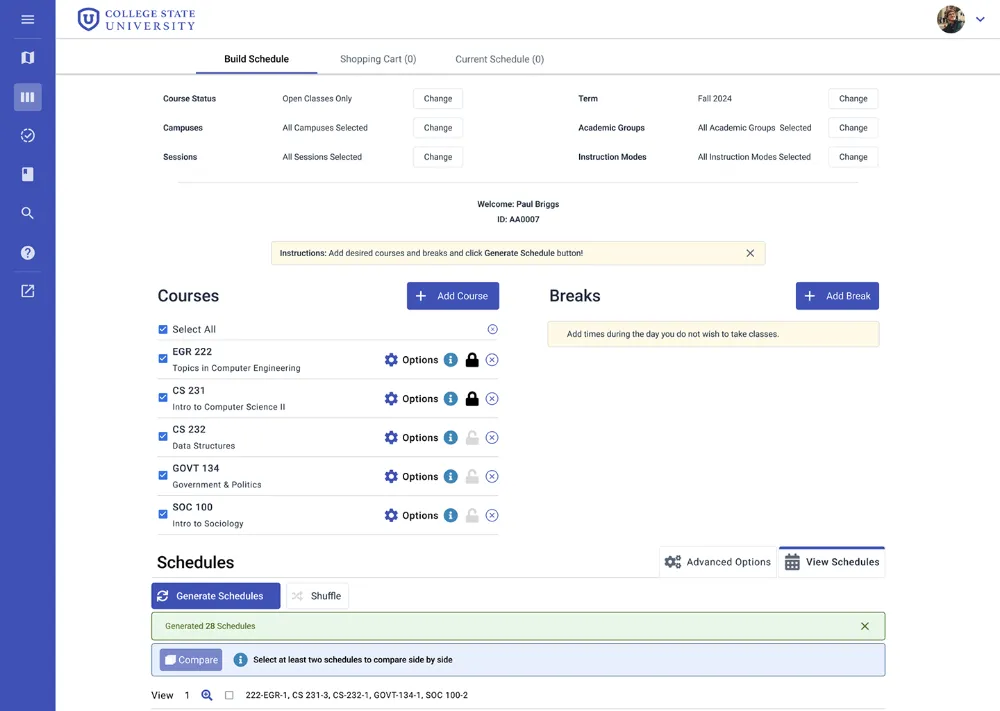
Find the Best Fit Schedule
Degree plans and schedules that fit academic goals, athletics or committee work, and personal commitments.
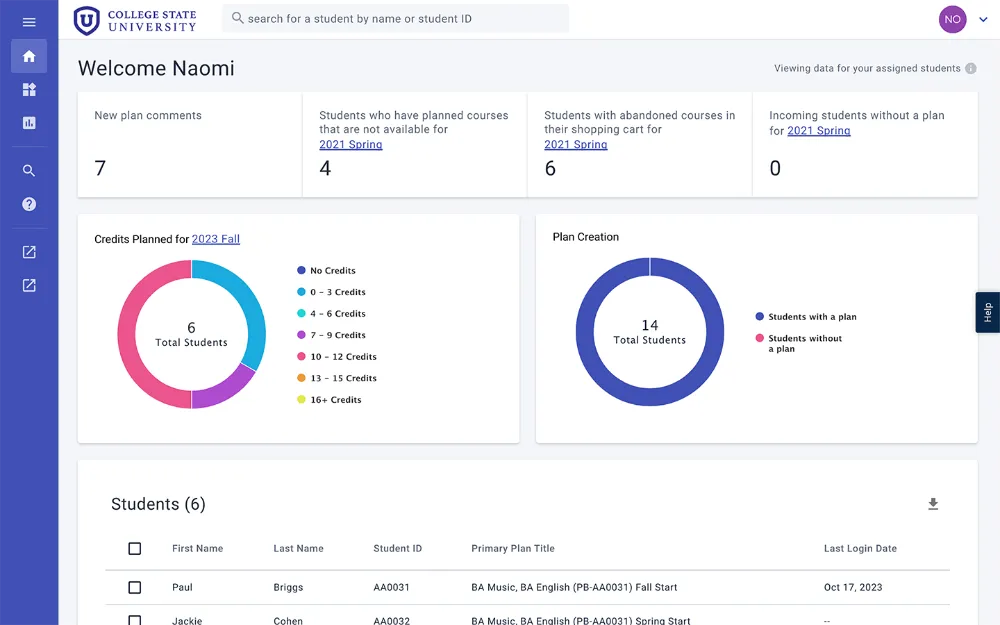
Prioritize Student Support
Watch planning and registration activity to prioritize outreach and tailor guidance.
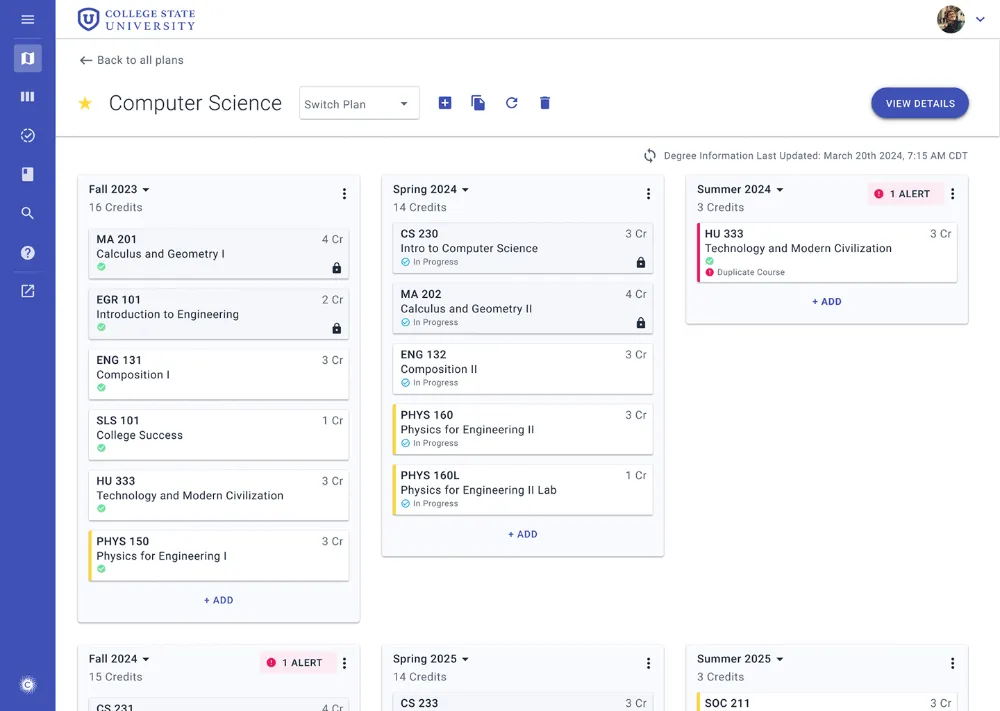
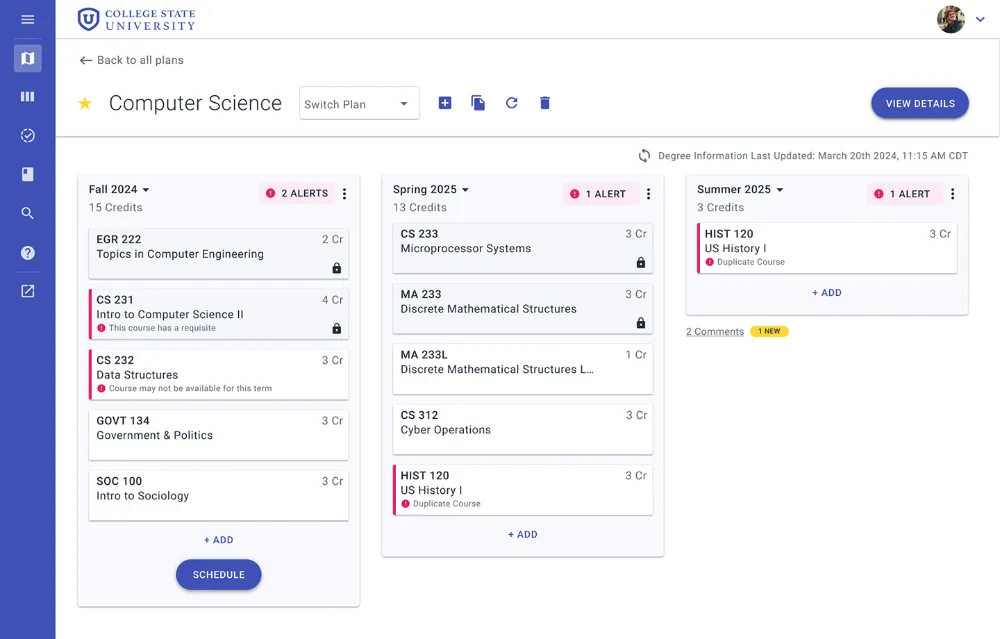
Avoid Roadblocks in Degree Planning
Students and advisors get real-time alerts about missing prerequisites and unavailable courses.
Every office gets a number. This page is one of six.
Enrollment, engagement, persistence, graduation, and career outcomes, each measured against a comparison group. The same data, the same model, one ledger for the cabinet, the board, and the Department of Education.
Civitas works under FERPA as a school official you designate, with a published data sharing agreement and platform specifications. Accessibility conformance reports are available on request. Security and privacy → Trust Center →
“With a streamlined experience and registration process, course scheduling during advising sessions is faster. This allows more time for advisors to engage with students on mission-focused topics, such as different degrees and faster graduation routes.”Juan Gilberto GarciaVice President for Enrollment Management, Texas A&M International University
Questions institutions ask about graduation & on-time completion
Short answers, in the words a cabinet uses. For anything not here, ask us directly.
Why do students stall so close to a degree?
Usually one blocked course, not lost momentum. Students thirty credits from a degree stall on one unavailable section or unmet requirement — findable a term ahead.
How do we raise our graduation rate?
Find each student’s specific barrier and remove it, instead of running a general campaign: the blocked plan, the unavailable section, the unmet requirement. Del Mar College grew graduation applications 26%, from 687 in Spring 2016 to 865 in Spring 2017.
What is degree planning worth to persistence?
In the 2026 Student Success Impact Report, academic planning produced a 10 percent sustained persistence lift over multiple years: 11 percent for new students and 15 percent for online students. The lift comes from plans students revisit, not plans filed once.
How does course scheduling affect completion?
A plan is only as good as the seats behind it. Demand forecasting shows which sections students need, so the schedule is built from degree plans, not last year's schedule.
Can we see time to degree, not just the six-year rate?
Yes. Time to degree, credit accumulation, and progression are tracked by population, where full-time and part-time completion differ.
Does this work for community colleges?
Yes. Austin Community College moved fall-to-spring persistence from 70.8% to 74.9% (Spring 2021 to Spring 2023) and increased two-year completion 13% (Fall 2015 to Fall 2021 cohorts).
Bring your questions. Leave with an estimate you can defend.
A 45-minute working session: we start from your public IPEDS figures, show what the platform found at institutions like yours, and size the outcome — before anyone touches your data.